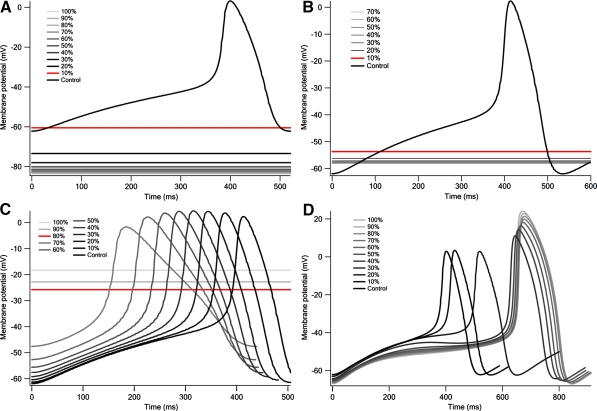
Fig. 4.
Effects of shifting relative activities of all current components (A), IK1 (B), IKr (C), and of all current components except IK1 and IKr (D). (A) Changes in action potential when shifting relative activities of all currents by 10% increments. (B) Changes in action potential when shifting from relative activity of early embryonic IK1 (darkest line) to that of late embryonic IK1 (lightest line) by 10% increments. Spontaneous action potential ceased when relative activity of IK1 was shifted by 10% (red line) or more toward late embryonic stage value. Dataset could not be obtained when the current was shifted by 90% and 100% toward the late embryonic stage value, owing to collapse in the balance of the ionic concentration. (C) Changes in action potential when shifting from relative activity of early embryonic IKr (darkest line) to that of late embryonic IKr (lightest line) by 10% increments. Spontaneous action potential ceased when relative activity of IKr was shifted by 80% (red line) or more toward late embryonic stage value. (D). Changes in action potential when relative activities of all currents except IK1 and IKr were shifted from early embryonic to late embryonic values by 10% increments

