
Figure 3.
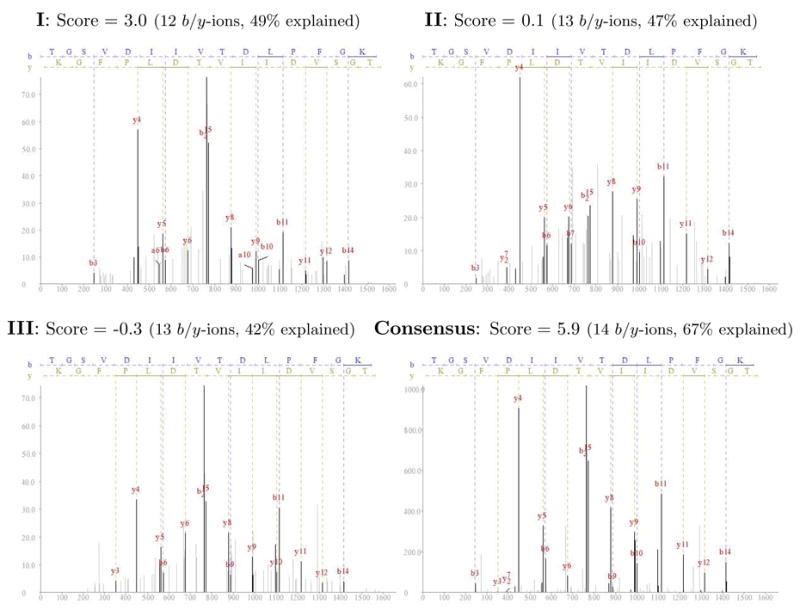
Example of cluster for the peptide TGSVDIIVTDLPFGK. A cluster of three spectra is shown along with the consensus spectrum that was created from them. For each spectrum the InsPecT score is shown, along with the number of identified b/y-ions and the percentage of the spectrum’s intensity that is explained by the peptide’s fragment ions. Only the consensus spectrum had a suffciently high score to be positively identified in the database search using InsPecT. All spectra have a precursor charge 2 with precursor m/z errors below 1 Da. The figures’ x-axes represents the fragments’ m/z values and the y-axes represents the intensities.