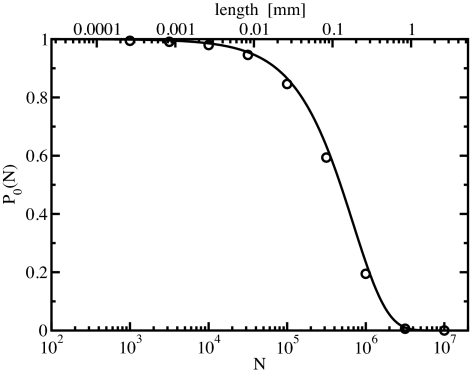
Fig. 3.
Order probability P0(N) obtained from canonical Monte Carlo simulations (circles) of a single chain as a function of the number of sites, N (lower x axis). Also shown is the order probability calculated according to Eq. 1 (solid line). The labels on the upper x axis indicate the corresponding tube length.

