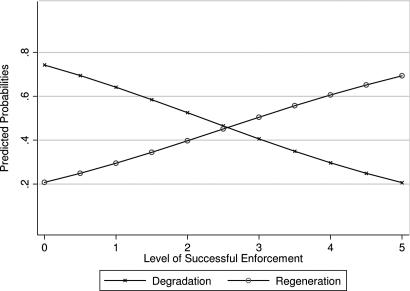
Fig. 2.
Relationship of level of enforcement with the predicted probability that a forest has degraded or regenerated. The level of successful enforcement (x axis) varies between 0 = no enforcement and 5 = strict enforcement. Probabilities are calculated holding all other variables at their median values.

