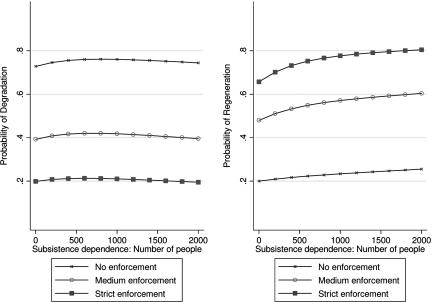
Fig. 5.
Relationship between the size of the user group and the predicted probabilities of degradation and regeneration. Each curve represents change in probability of degradation (Left) and regeneration (Right) with change in the group size for a given level of enforcement, holding all other variables in the model at their median values.

