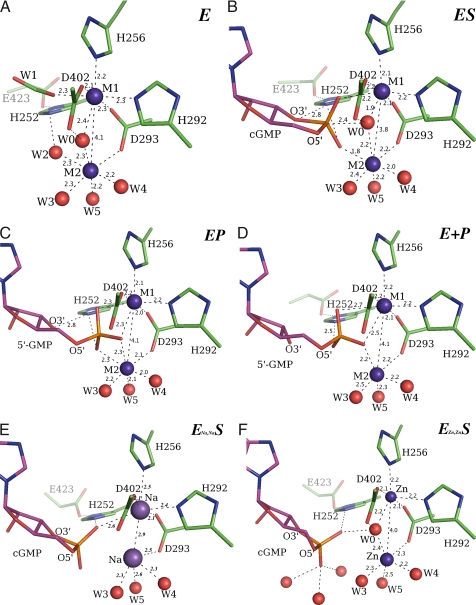
Fig. 3.
Structures of PDE9 hydrolysis centers. Distances within hydrogen bond lengths are shown by dashed lines. Some key distances are given also. For clarity, only protein side chains are shown. (A) An example of unliganded, active PDE9 hydrolysis center (active site B of crystals soaked with 1 mM cGMP + 0.5 mM MnCl2). In this case, both M1 and M2 are Mn2+ ions. Similarly, M1/M2 can have Mn2+-Mg2+, Zn2+-Mg2+, or Mg2+-Mg2+ configurations. When M1 is Mn2+, W1 is a formate ion from solvent. W1 is a water with partial occupancy when M1 is Zn2+ or Mg2+. (B). cGMP (magenta carbons) interacting with the active PDE9 hydrolysis center (green carbons) in the putative ES complex. In the ES and EP complex, only H252 Nε2-O3′ interaction has ideal geometry for hydrogen bond. (C) 5′-GMP interacting with the active PDE9 hydrolysis center in the putative EP complex. (D) 5′-GMP interacting with the active PDE9 hydrolysis center in the putative E+P complex. (E) cGMP bound at the PDE9 hydrolysis center inactivated by Na+ ions occupying both the M1 and M2 sites. (F) Bound cGMP at the inactive PDE9 hydrolysis center. Zn2+ ions occupy both M1 and M2 sites.

