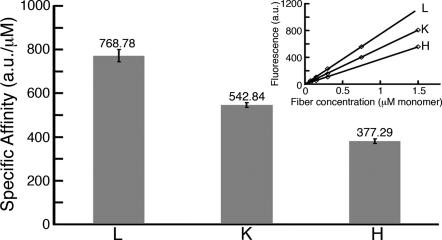
Fig. 2.
Specific ThT affinities. The affinity value (on top of the bars) is the average of four to six independent measurements, each with an independent sample (n = 6 for [VH] and [VK]; n = 4 for [VL]). The inset shows single measurements. A sample was directly diluted to four concentrations. Affinity (α) was measured in excess of ThT (12.5 mM). Data are least squares fitted by using the linear equation y = αx. (R2 > 0.99 for all measurements). Error bars represent SD.

