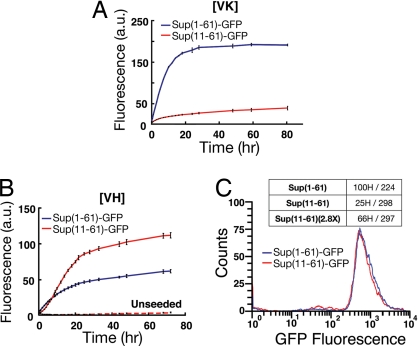
Fig. 3.
Seeding of Sup (1–61)-GFP and Sup (11–61)-GFP fibers. (A) [VK] seeds. (B) [VH] seeds. The curves represent measured ThT intensity. The protein concentration is 4 mM for all experiments. Experiments were performed in duplicates. Error bars indicate SD. The ratio of specific ThT affinities [Sup(1–61)/Sup (11–61)] was determined to be 2.1 for [VK] fibers and 0.4 for [VH] fibers (72 h after seeding). (C) Diminished infectivity of [VH] Sup (11–61)-GFP fibers. Flow cytometry is used to normalize fiber length distribution. The Sup (11–61) sample has lower specific infectivity (25H/298: 25 [VH] of 298 randomly picked colonies).

