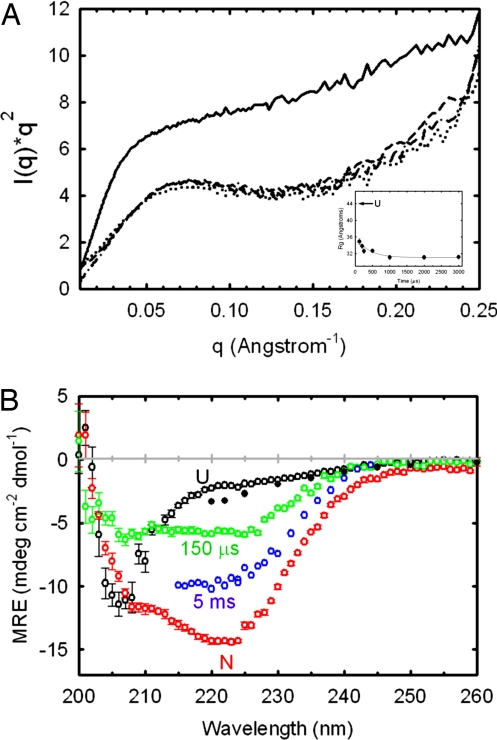
Fig. 2.
SAXS and CD spectra of αTS as a function of refolding time. (A) Kratky plots at 150 μs (dotted line), 1 ms (dashed line), and 5 ms (dotted-dashed line). The unfolded Kratky plot recorded at 6 M urea (solid line), normalized to the concentration used for the kinetic data, is shown for reference. The Rg of the native state of αTS is 18.1 Å (51). Refolding was initiated by a urea concentration dilution from 6 to 0.6 M. The final protein concentration was 1 mg·ml−1. (Inset) Dependence of Rg on refolding time. Each scattering curve in A and time point in the Inset represents a total accumation time of ≈5 s. (B) CD spectra of αTS at various refolding times. Spectra at 150 μs (green open circles) and 5 ms (blue open circles), acquired after an 8–0.8 M urea concentration jump, are compared with the native spectrum (red open circles), the unfolded spectrum recorded at 8 M urea (black open circles) and the unfolded spectrum extrapolated to 0.8 M urea (black filled circles). The 150-μs spectrum, the native spectrum at 0.8 M urea, and the unfolded spectrum at 8 M urea were acquired with the same stock solutions in the continuous-flow mixer having a 127-μm optical path. The 5-ms time point spectrum was acquired by using the stopped-flow cuvette with a 1.5-mm optical path. Sample concentration was 60 μM for data recorded in the continuous-flow mixer and 10 μM for the stopped-flow data. The extrapolation of the unfolded baseline was performed by using published data and global fit parameters (52). Data were recorded at 21°C.

