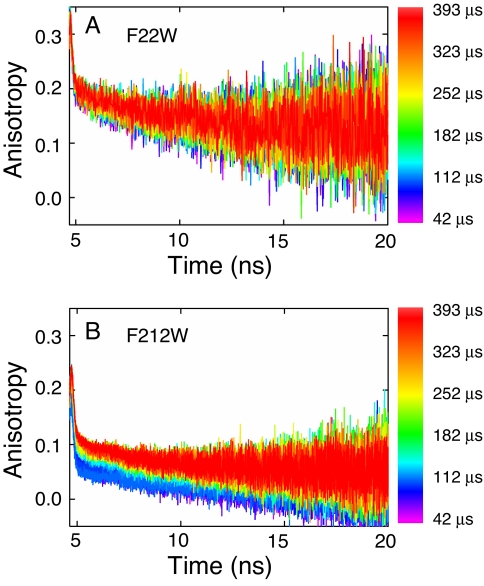
Fig. 5.
Time-resolved anisotropy as a function of refolding time for F22W (A) and F212W (B) after an 8–0.8 M urea concentration jump. TCSPC curves were acquired every 10.93 μs in refolding time, and refolding times are indicated by the color-coding shown on the right. The total flow rate was 17.5 ml·min−1 (1.75 ml·min−1 protein and 15.75 ml·min−1 buffer), which corresponds to a 32.65 μs·mm−1 linear flow velocity in the channel. Data were recorded at 21°C in 10 mM phosphate buffer containing 0.2 mM K2EDTA and 1 mM βME. Final protein concentration was 10 μM.

