Fig. 5.
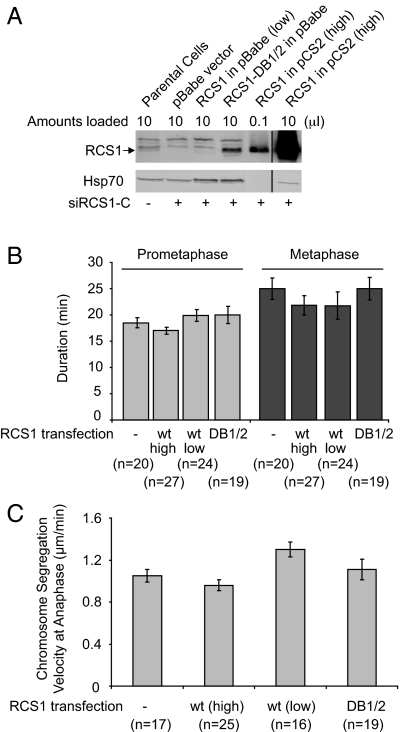
Expression of a nondegradable RCS1 mutant does not affect M-phase progression. (A) Determination of the levels of ectopically expressed RCS1 and RCS1-DB1/2. HeLa cells were transfected with siRCS1-C to deplete endogenous RCS1 and then transfected with RCS1 or RCS1-DB1/2. Levels of RCS1 and Hsp70 were assayed by Western blotting. The pBabe vector drives the expression of RCS1 and RCS1-DB1/2 at relatively low levels with a weak LTR promoter, whereas pCS2 drives the expression of RCS1 at a high level with a strong CMV promoter. An anti-RCS1 antibody different from the one in Figs. 3 and 4 was used here, and bands above RCS1 correspond to cross-reacting bands. The vertical lines in the figure indicate where intervening (irrelevant) lanes had been removed from the gel images. (B and C) The pBabe vector, RCS1-DB1/2 in pBabe, RCS1 in pBabe, and RCS1 in pCS2 were cotransfected with a RFP vector into HeLa/GFP-H2B cells, and GFP-H2B was imaged at 44 h after transfection. As fusion of a GFP tag to either the N or C terminus of RCS1 interferes with its degradation (data not shown), cotransfection of RFP, which accounts for 5% of transfected DNA, was used here to identify transfected cells. The durations (min) of prometaphase and metaphase (B) as well as the rate of chromosome segregation at anaphase (C) in transfected RFP-positive cells were determined by analysis of timelapse images. The number of cells in each experiment is indicated. As depletion of RCS1 affects the kinetics of the metaphase-to-anaphase transition, experiments described here were done in the presence of endogenous wild-type RCS1. Error bars, SEM.

