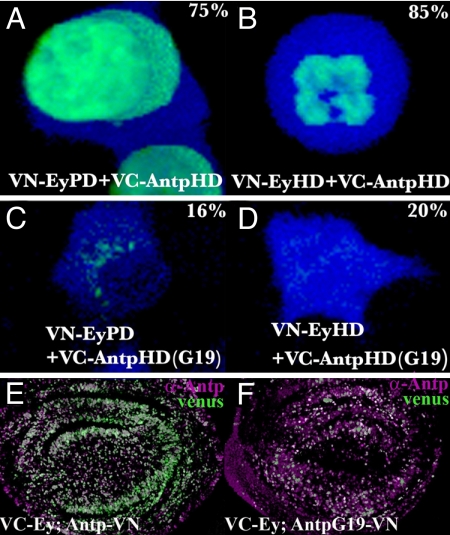
Fig. 5.
BiFC analysis of protein–protein interactions. (A–D) Interaction between EyPD and AntpHD (A) or between EyHD and AntpHD (B) resulted in a strong Venus fluorescence signal. Percentage positive cells are indicated. The G19 mutation dramatically reduces the interactions to the EyPD (C) or EyHD (D). CFP counterstains the cytoplasm. (E and F) Full-length EY/ANTP WT and G19 interactions were detected in wing discs (green). Level of ANTP expression is monitored by immunostaining (magenta).

