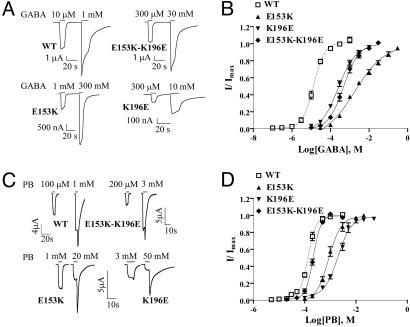
Fig. 2.
GABA and PB concentration–response curves. (A and C) Representative GABA and PB currents from oocytes expressing WT α1β2γ2S, α1β2E153Kγ2S, α1β2K196Eγ2S, and α1β2E153K-K196Eγ2S GABAARs. (B and D) GABA and PB concentration-response curves from oocytes expressing α1β2γ2S (open squares, dashed line), α1β2E153Kγ2S (filled triangles), α1β2K196Eγ2S (inverted filled triangles), α1β2E153K-K196Eγ2S (filled diamonds) receptors. Data points represent mean ± SEM from at least three experiments and at least two batches of oocytes. Data were fit by nonlinear regression analysis as described in Materials and Methods.

