Fig. 3.
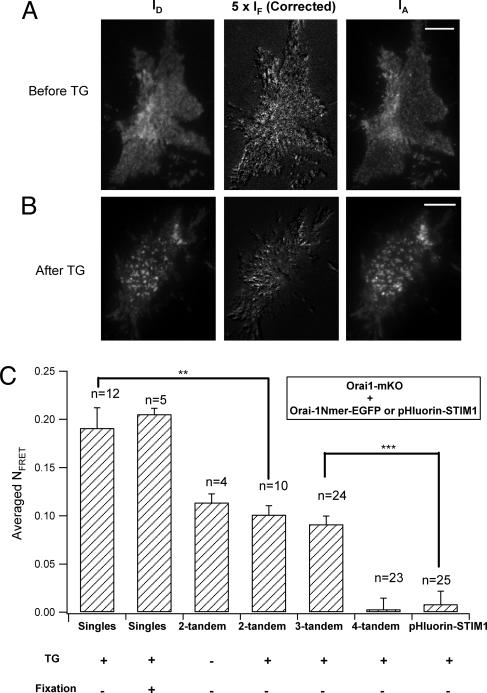
FRET between Orai1 singles and tandem multimers in living cells observed under TIRF microscopy. (Scale bars, 10 μm.) (A) Images IA and ID (see Methods) for a representative resting cell coexpressing Orai1-mKO and two-tandem Orai1-EGFP, excited by the 488-nm laser. The corrected FRET image was obtained from the raw IF image by subtracting the EGFP fluorescence bleedthrough to the red channel and the direct excitation of mKO by the 488-nm laser and then scaling by a factor of 5 to improve visibility. Most of the fluorescent regions of the cell show appreciable Orai1-Orai1 FRET. (B) Similar images for cells stimulated with TG (1 μM) for 10 min. Orai1 has assembled into aggregates on the plasma membrane. (C) Summaries of mean NFRET (see Methods) between Orai1-mKO and different EGFP-tagged vectors. No FRET signal was detected when cells were co-expressing Orai1-mKO and EGFP-tagged four tandem (**, P < 0.01; ***, P < 0.001).

