FIG. 13.

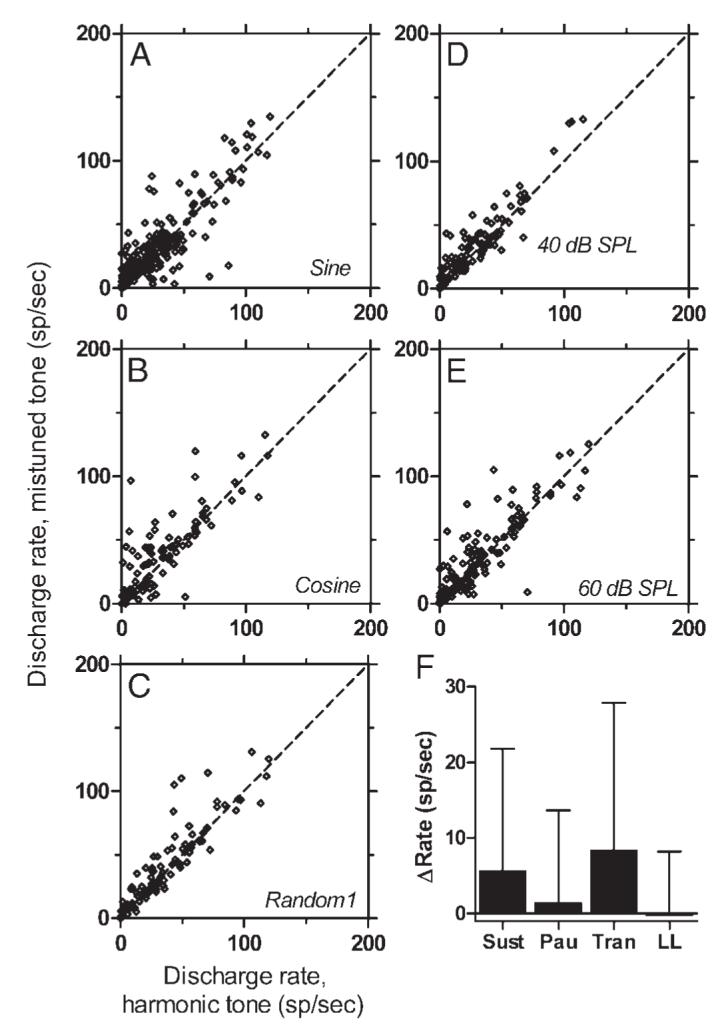
Summary of the effect of mistuning on average discharge rate. Each point compares the average discharge rate elicited by a harmonic tone to the rate elicited by a mistuned tone for which all other parameters matched those of the harmonic tone. Points falling above the diagonal (dashed line) indicate higher rates for the mistuned tone. A: comparison of 260 data sets obtained with sine-phase tones; SPL varied. B: comparison of 96 data sets obtained with cosine-phase tones; SPL varied. C: comparison of 97 data sets obtained with random-phase tones; SPL varied. D: comparison of 106 data sets obtained with tones presented at 40 dB SPL per component; component phase varied. E: comparison of 142 data sets obtained with tones presented at 60 dB SPL per component; component phase varied. F: mean change in rate as a result of mistuning for neurons sorted by PST type. Positive numbers indicate that rate increased as a result of mistuning, and the error bars are SDs. “Sust”: 257 data sets from 48 sustained neurons. “Pau”: 91 data sets from 17 pauser neurons. “Tran”: 31 data sets from 11 transient neurons. “LL“: 101 data sets from 18 long-latency neurons.
