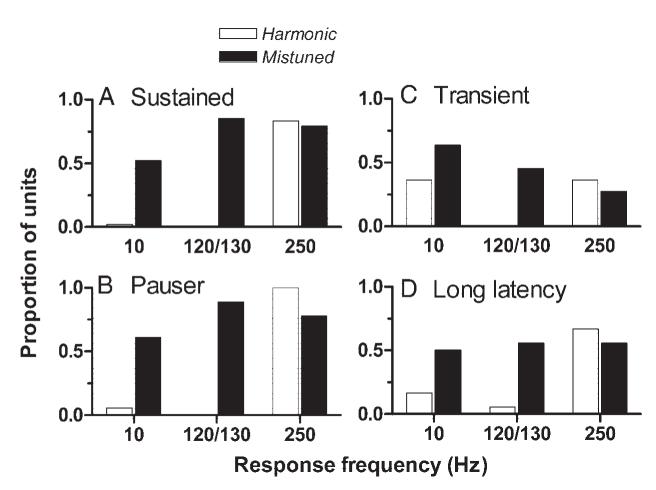
FIG. 6.
Patterns of discharge synchrony for harmonic and mistuned tones. A: each bar shows the proportion of neurons for which statistically significant discharge synchrony was observed at various frequencies. Proportions are shown separately for responses at 10, 120 or 130, and 250 Hz. A neuron was counted if it exhibited statistically significant synchrony at the indicated frequency for at least one stimulus condition. Filled bars: pattern across 48 sustained neurons in response to mistuned tones. Open bars: pattern across the same neurons in response to harmonic tones. B: same as A, from 18 pauser neurons. C: same as A, from 11 transient neurons. D: same as A, from 18 long-latency neurons.

