
Figure 3.
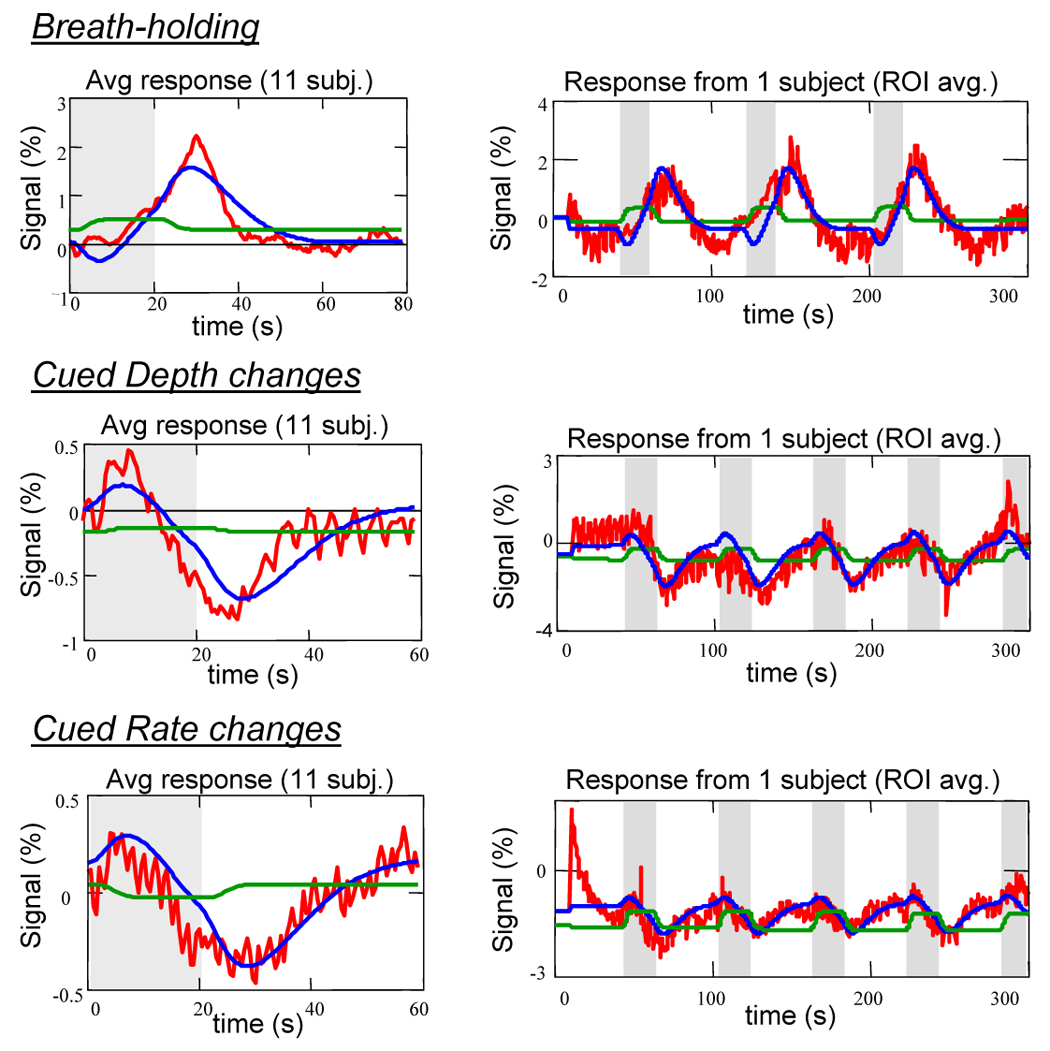
Red: Averaged MRI time courses in response to various respiration modulations: Breath-holding, cued Depth changes, and cued Rate changes. Blue curves: fit of RVT convolved with respiration response function. Green curve: fit of RVT time course convolved with typical Gamma-variate used for activation-induce BOLD responses. Figures on left are averaged across 11 subejcts. Figures on right show the entire time course (averaged over the brain) for one representative subject.