
Figure 6.
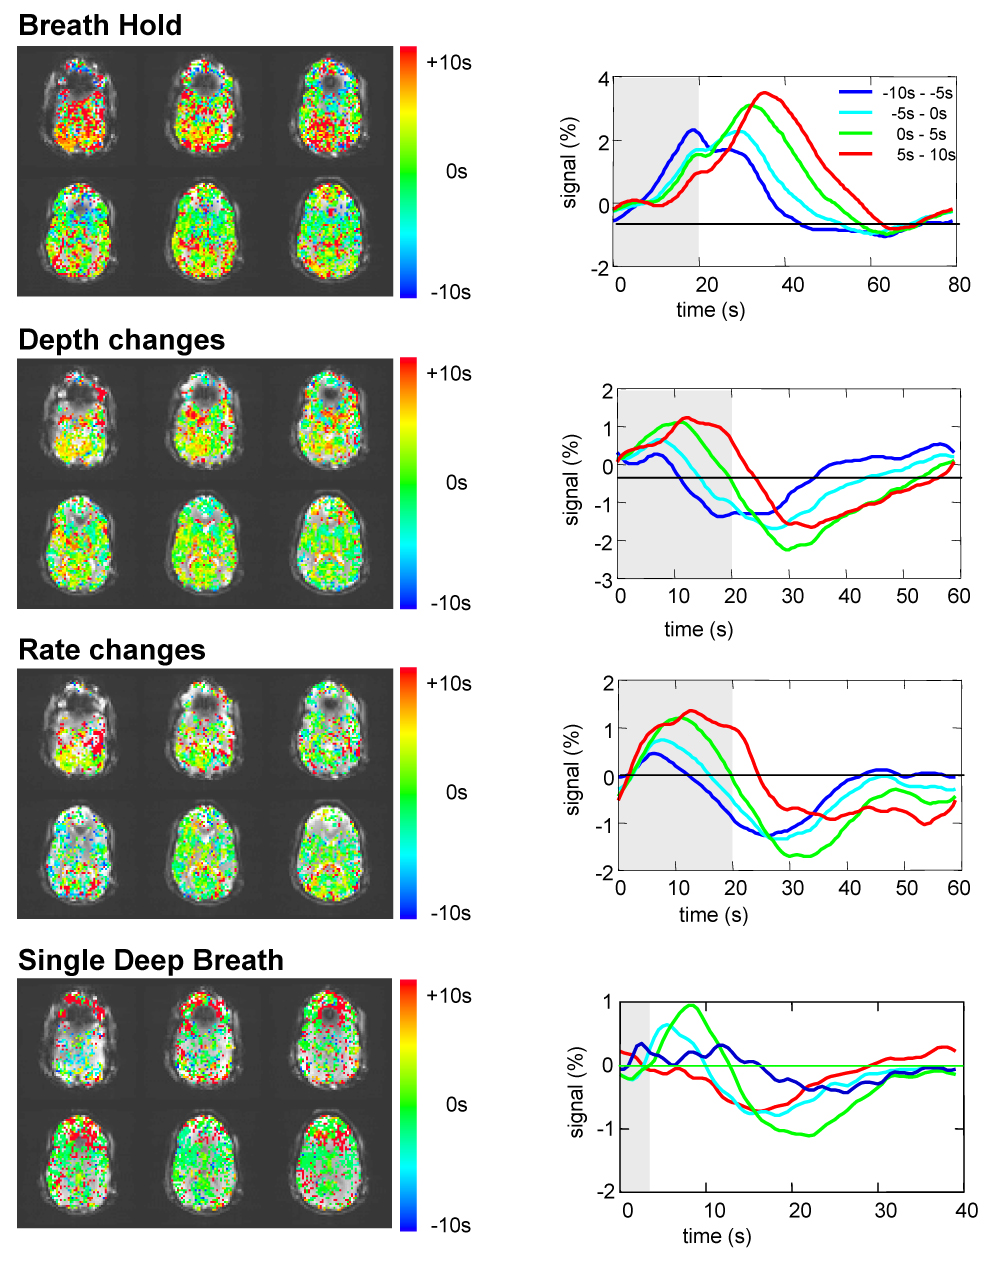
Left: Maps showing the optimal latency for each voxel in fitting the RVT time course (RVT(t)) convolved with RRF to the different cued respiration changes (breath-hold, cued rate changes, cued depth changes). These values reflect the amount that the RVT(t)*RRF had to be shifted in order to result in the optimal fit. Right: average signal intensity time courses for voxels with the optimal latency within four ranges: (−10s to −5s, −5s to 0s, 0s to 5s, and 5s to 10s).