
Figure 4.
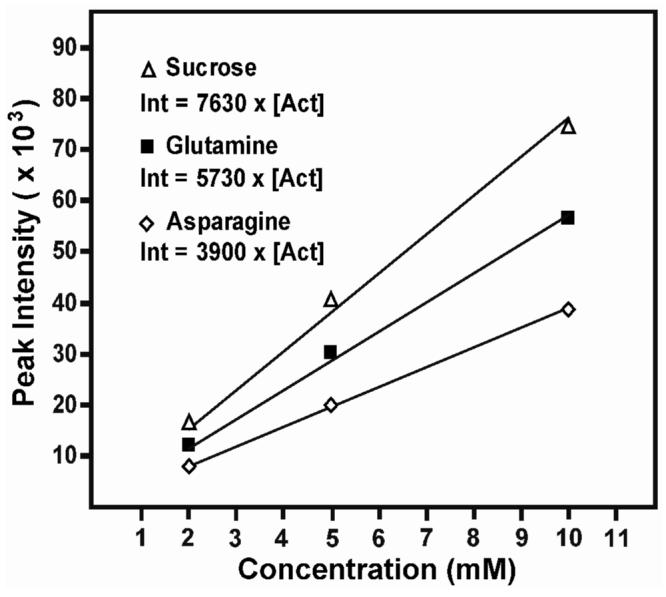
Two-dimensional 1H-13C HSQC NMR peak intensities for three metabolites in the concentration reference samples plotted as a function of known concentration. The concentration of metabolites in the test samples were calculated from the best fit regression lines of the concentration reference samples.