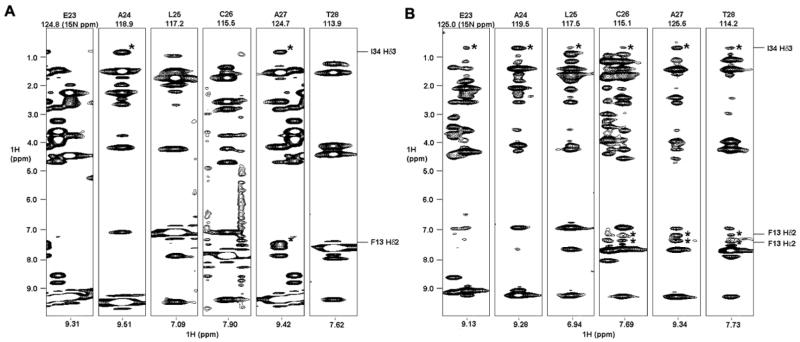
Figure 4.
2D strips at the indicated 15N chemical shift from 3D 1H-15N NOE-HSQC data sets. The results show different patterns of 1H-1H NOE cross-peaks from crambin(P22,L25) in (A) in the mixed solvent and (B) in DPC micelles. Cross-peaks of interest are asterisked, and the corresponding atoms depicted to the right. Experiments were done with 150 ms mixing times.

