
Figure 6.
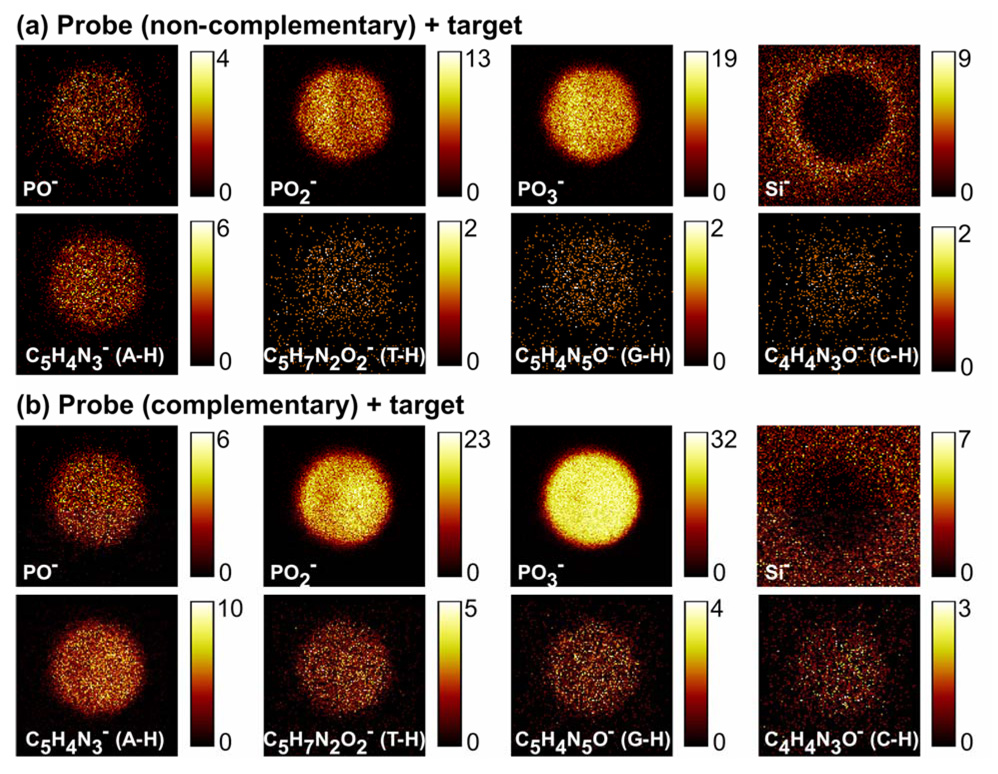
Representative negative ion ToF-SIMS images showing the distribution of DNA and substrate fragments within single (a) unhybridized and (b) hybridized microarray spot. The DNA fragments are localized to the non-contact printed regions but distributed inhomogeneously within the micro-spot. The Si image from the unhybridized probe spot (a) showed a “halo” feature around the spot. Brighter pixel intensity corresponds to higher DNA or substrate signals (counts per pixel). Images are 200 µm ×200 µm.