Figure 11.

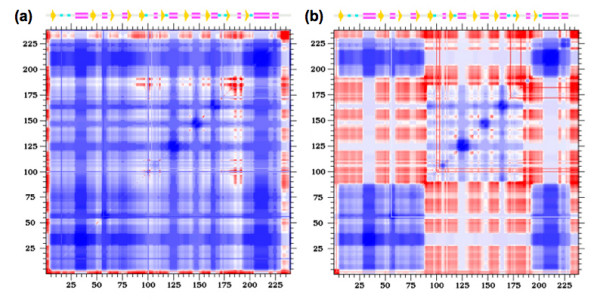
Cooperativity correlation plots of the (a) ligated and (b) apo LAOBP structures. Note that the color-coding is the same as in Fig. 9, and that panel (a) is exactly the same as Fig. 9a.

Cooperativity correlation plots of the (a) ligated and (b) apo LAOBP structures. Note that the color-coding is the same as in Fig. 9, and that panel (a) is exactly the same as Fig. 9a.