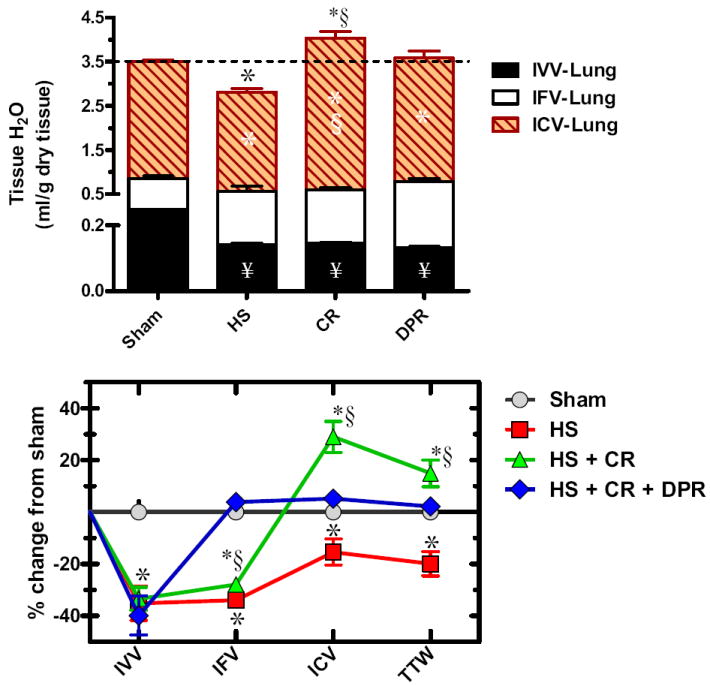
Figure 4.

Water distribution within the gut (upper panel); and water redistribution relative to sham control (lower panel). Y axis in the upper panel was divided into two segments to visualize the small intravascular volume (IVV). IFV, local interstitial fluid volume fraction; ICV, local intracellular fluid volume fraction; hatched line represents total tissue water in the sham control group; Sham, sham operation, no hemorrhage; HS, hemorrhagic shock; CR, conventional resuscitation with return of shed blood plus 2 volumes of lactated Ringers’ solution; DPR, direct peritoneal resuscitation with 20 mL glucose-based clinical peritoneal dialysis solution IP. *p < 0.01 versus sham by two-way ANOVA and Bonferroni posttest. §p < 0.05 versus sham control by two-way ANOVA and Bonferroni posttest. §p < 0.01 versus group IV (HS+CR+DPR) by two-way ANOVA and Bonferroni posttest.
