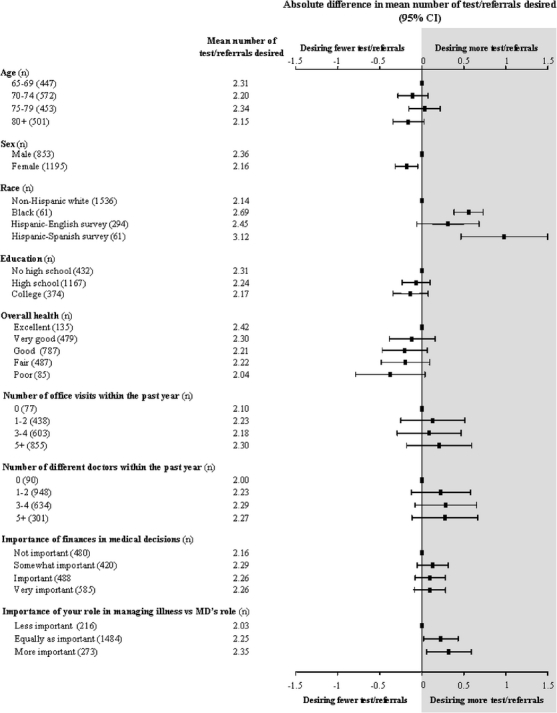
Figure 3.

Desire for tests and referrals by patient characteristics (adjusted for all characteristics in Table 2), the mean number of the 4 possible tests or referrals desired by patient characteristics (after adjusting for all characteristics in Table 2). The absolute differences within each patient characteristic are presented graphically—this represents how many tests or referrals patients desired compared to the referent category (difference = 0).
