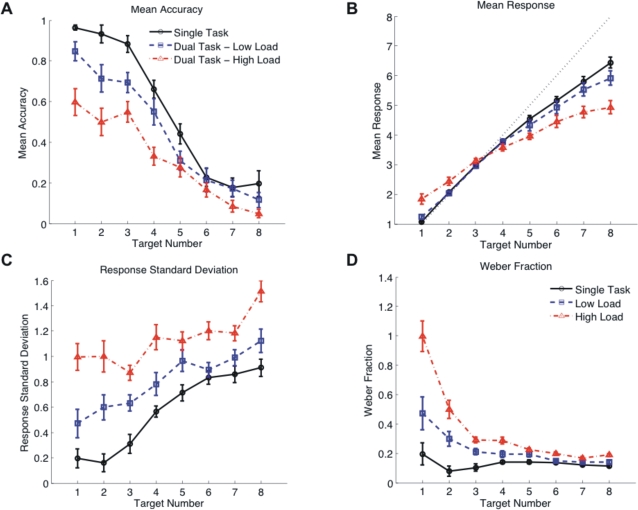
Figure 3. Results of the Numerosity Task.
Performance of the numerosity task under the three experimental conditions (single task (black), low load (blue) and high load (red)). Error bars indicate one standard error of the mean. (a) Mean accuracy (proportion correct). (b) Mean responses. The dotted diagonal indicates perfect performance, values above the line represent overestimation, values below underestimation. (c) Response standard deviation. (d) Weber fraction (response STD/target number).

