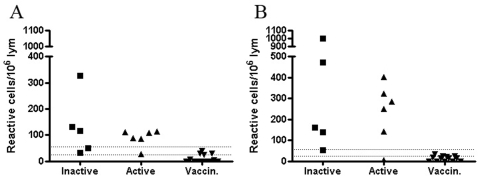
Figure 2. Production of IFNγ by lymphocytes stimulated with ESAT-6 (Panel A) and CFP-10 (Panel B) was tested in the ELISPOT technique.
The groups of patients with inactive TB (n = 5), active TB (n = 6) and healthy vaccinated subjects (n = 13) were tested. Cell-mediated immunological responses were determined as the number of reactive cells per 106 lymphocytes. The lower dotted line is the level of positivity suggested by the manufacturer, the upper dotted line is the level of positivity adopted at the HUSLAB diagnostic laboratory. The area between the two dotted lines represents the so-called grey-zone, an area of uncertainty for interpretation that was calculated based on assay imprecision (data not published).

