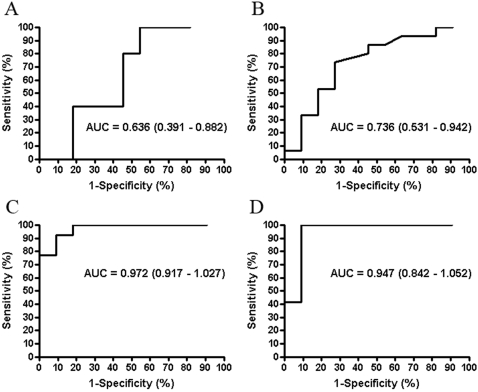
Figure 4. ROC curves were constructed to compare ELISPOT results when the cells were stimulated with rMtb-HBHA (A), PPD (B), and peptide mixtures of ESAT-6 and CFP-10 (C–D).
The curves were established for infected (Active and Inactive TB) and the healthy control group. The calculated AUC and the respective confidence intervals (in brackets) are shown for each tested antigen.

