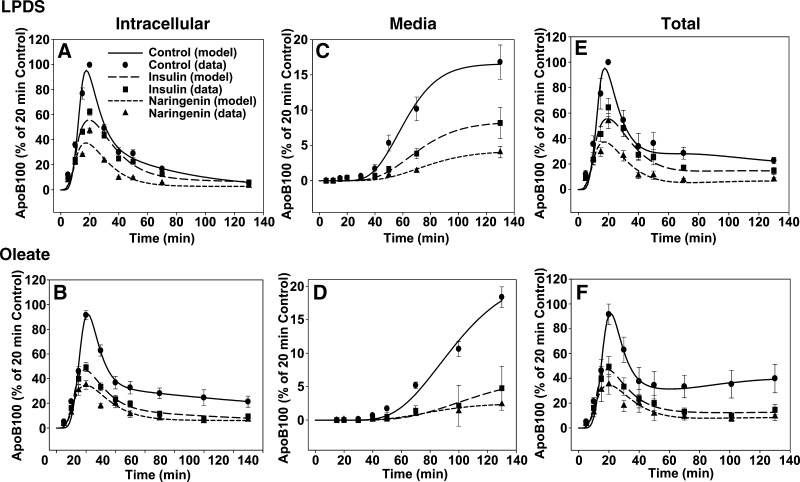
Fig. 6.
Naringenin and insulin similarly inhibit the secretion of apoB-100 from HepG2 cells through a kinetically defined rapid intracellular degradation pathway. HepG2 cells were preincubated for 24 h in lipoprotein-deficient serum (LPDS) with naringenin (100 μM, triangles), insulin (100 nM, squares), or DMSO (control, circles). Cells were then incubated for a further 20 min in the absence (A, C, E) or presence (B, D, F) of 0.1 mM oleic acid prior to pulse labeling (10 min). Cells were then chased for a further 120 min in the presence of their respective treatments in LPDS or oleate-enriched media. Intracellular apoB-100 radioactivity is shown in panels A and B, apoB-100 radioactivity secreted into the media is shown in panels C and D, and total apoB-100 radioactivity (determined as the sum of apoB-100 in the media and in the cell) is shown in panels E and F. The symbols in each graph represent apoB-100 radioactivity measured experimentally and are expressed as the mean ± SEM for four experiments (LPDS) and five experiments (oleate). The curves in each graph are fits to the experimental data obtained from analyses using the multicompartmental model shown in Fig. 1.

