Fig. 2.
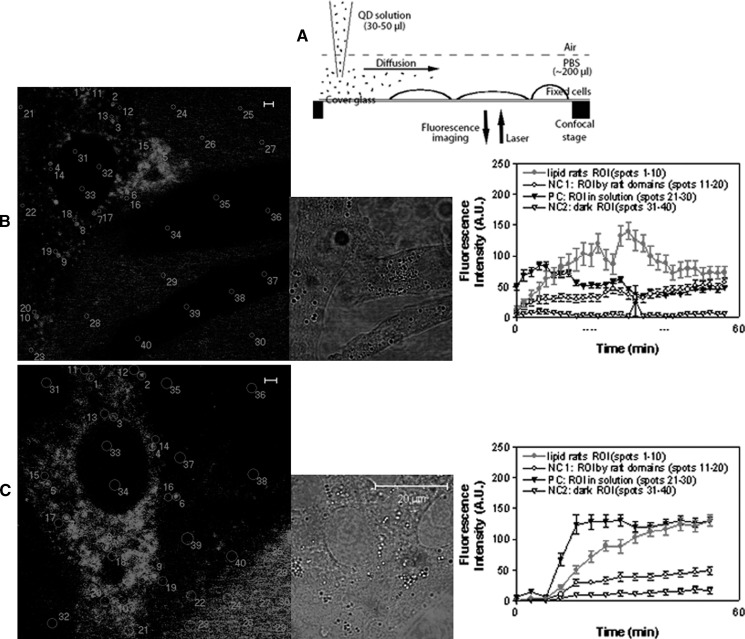
Real-time confocal microscopic imaging of dynamic QD staining of GM1 or GM3 microdomains in the apical plasma membrane of MDCK cells. A: Schematic diagram for adding QD solution to MDCK cells for staining under confocal microscope. B and C were confocal images showing formation and dynamics of QD-stained GM1 and GM3 microdomains on cell surface, respectively. Left panels: snapshots of the dynamics displaying many regions of interest (ROIs) marked by circles/numbers, from which the mean fluorescence intensity (MFI) was measured. Middle panels: corresponding DIC images. Right panels: MFI vs. time graphs showing changes in mean MFI (mean ± SD) of randomly-chosen 10 ROIs corresponding to the circles as numbered in the images of the left panels. Four types of ROIs were measured: i) lipid raft ROI (circles 1–10 in the left images): GM1 or GM3 microdomains on cells; ii) NC1 (negative control 1; circles 11–20), ROI: the areas nearby the microdomains (but obviously not in the microdomains); iii) PC (positive control; circles 21–30), ROI: the QD solution areas outside cells, which gave rise to fluorescence due to the QD particles suspending in solution; iv) NC2 (negative control 2; circle 31–40), ROI: the areas inside cells, which were dark (no fluorescence) since QDs could not enter the prefixed cells. Note that MFI curves for GM1 or GM3 raft ROI were increased over time, indicating that accumulative QD staining of GM1 or GM3 microdomains instead of preformed QD aggregates binding to the GM1 or GM3 molcules. The MFI curves for PC ROI started early and relatively stable, which could be explained by the presence of QD particles in solution. No apparent increases in MFI were detected for the NC1 and NC2. Of note, the decrease in fluorescence intensity at the late stage as seen in the right graph of B was probably due to photobleaching and/or diffusion of QD particles from one to other areas of the investigated cell. The distance, concentration, and diffusion rate of QD solution together with other factors appeared to affect the speed at which the QD particles reached the cell surface for staining and therefore impacted on the MFI of QD solution around the cells, the increase in MFI for staining GM1 (B) or GM3 (C) microdomains, and the time of starting the increase. This appeared to explain why the increase in MFI for QD staining of GM1 microdomains in B started earlier than that of GM3 microdomains in C.

