Fig. 3.
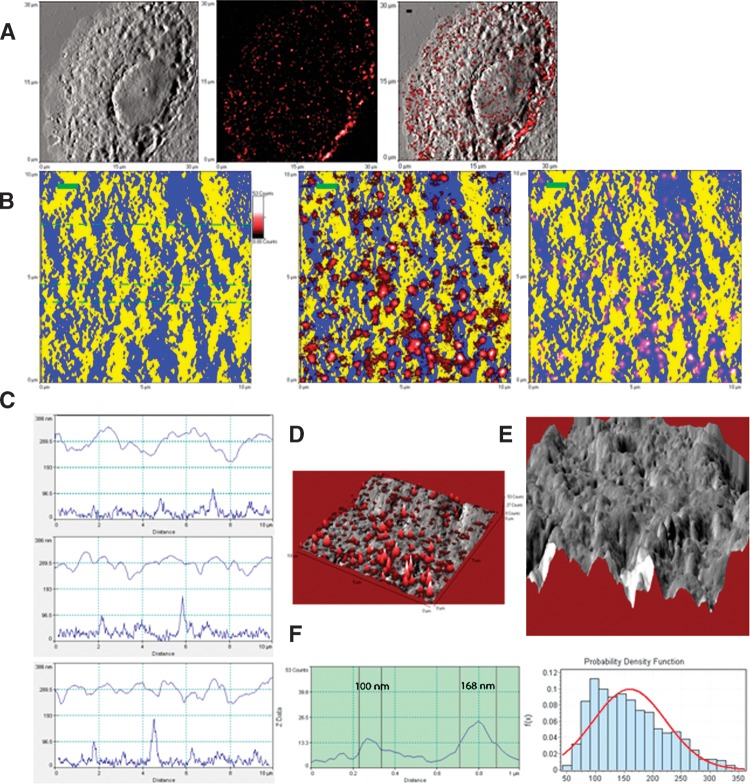
Direct in situ fluorescence-topographic NSOM imaging and quantification of GM1 rafts localized predominantly in membrane valleys. A: NSOM topographic (left), fluorescence (middle), and merged (right) images of a representative GM1+ MDCK cell. B: Higher-magnification topographic (left) and fluorescence-topographic merged (middle and right) two-dimensional (2D) images of an area on the cell in Fig. 3A. The topographic information was pseudo-colored in yellow for the peak of membrane protrusions, and in blue for the planar membrane or the valley between membrane protrusions. In the middle fluorescence-topographic image, the fluorescence information (in red) was above but not merged with the topographic information (in yellow/blue), highlighting all GM1 rafts in red. In the right fluorescence-topographic image, the topographic and fluorescence information were merged, highlighting the valley-localizing GM1 rafts in pink. Scale bar = 1 μm. Note that GM1 rafts were mainly localized in planar or valley membrane. C: The height (upper curves) and corresponding fluorescence (lower curves) profiles of the cross-sections extracted from the left panel of Fig. 3B (dashed lines). Note that GM1 fluorescence corresponded to the low height areas (planar or valley membrane). D: The NSOM topographic (gray)-fluorescence (red) merged three-dimensional (3D) image of Fig. 3B shows GM1 rafts were localized in planar or valley membrane. E: The topographic 3D image of the first panel of Fig. 3B. F: left panel: the fluorescence profile extracted from a cross-section through two GM1 rafts in the middle image of Fig. 3B, with diameters (FWHM) of these nanodomains being ∼100 nm and ∼168 nm, respectively. Right panel: the histogram for the diameters of GM1 rafts (159.5 ± 63.8 nm; ∼42 nm–360 nm). Shown is the representative of three GM1+ MDCK cells from three independent experiments.

