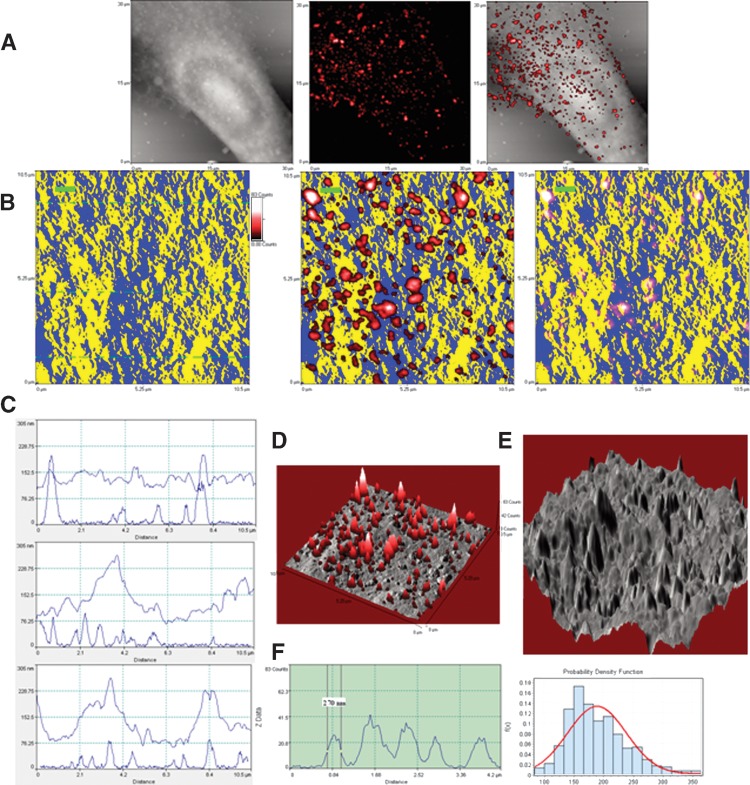
Fig. 4.
Direct in situ fluorescence-topographic NSOM imaging and quantification of GM3 rafts predominantly localized in membrane peaks. The legends are the same as described in Fig. 3 except GM3 replacement for GM1. Note that in contrast to GM1, GM3 were predominantly localized in the membrane peaks as seen in B–E. In the left panel of F, one of the five GM3 rafts has a diameter of ∼270 nm. In the histogram for the diameters of GM3 rafts (right panel of F), the mean diameter is 190.0 ± 49.8 nm (∼84 nm–365 nm). Shown is the representative of three GM3 + MDCK cells from three independent experiments.

