
Fig. 1.
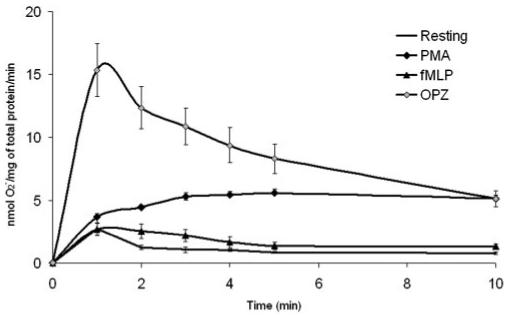
Characterization of O2- generation by stimulated, normal human mononuclear phagocytes. After isolation, mononuclear phagocytes from healthy controls (n=7) were stimulated with fMLP (1 μM), PMA (200 nM), or OPZ (2.5 mg/ml). O2- release was measured by the SOD-inhibitable cytochrome C reduction assay continuously up to 10 min. Cells treated with PBS alone were considered unstimulated. The rates of O2- production (nmol O2-/mg total protein/min) in response to different stimulations at each time-point are shown. All values represent the average ± se.