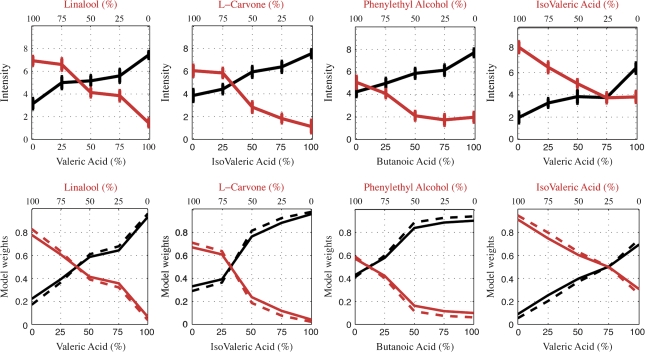
Figure 2.
Top: Intensity estimates of the separated constituents diluted with clean air to the overall flow rate of their corresponding mixtures. In each experiment session, these 10 randomized stimuli were estimated for their intensity on a number-free VAS scale ranging between “extremely mild” (0) and “extremely intense” (10). X axis is the approximated percentage of the neat odorants (see Table 1). Y is the median of the intensity estimates of all subjects with corresponding standard errors of the mean. VA – LIN: n = 21, IVA – LC: n = 20, BA – PEA: n = 22, VA – IVA: n = 21. Bottom: Model weights constructed from the constituents’ intensities (top panel) for the 2 models that performed best: dashed, weights implemented from the “interaction model” (Olsson 1994, eq. 5); continuous, weights of the sin model (eq. 2). These weights were substituted as the linear summation coefficients (WA, WB), composing the mixture's pleasantness (eq. 1).

