
Table 3.
Performance levels of the 4 prediction models expressed by their R2 values for each of the tested binary mixtures
| Mixture type | VA + LIN | IVA + LC | BA + PEA | VA + IVA |
| R2 (sin model) | 0.8848 | 0.9406 | 0.9042 | 0.8711 |
| R2 (squared intensities) | 0.8769 | 0.9463 | 0.9209 | 0.8585 |
| R2 (intensity weights) | 0.8969 | 0.9163 | 0.8395 | 0.8293 |
| R2 (arithmetic mean) | 0.7748 | 0.6409 | 0.5146 | 0.1415 |
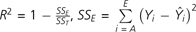 , and
, and 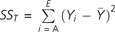 . (VA, valeric acid; LIN, linalool; IVA, isovaleric acid; LC, L-carvone; BA, butanoic acid; PEA, phenylethyl alcohol). First row is the sin model (eqs 1 and 2). Second row is the squared weighted intensities model (eqs 1 and 5) followed by the integrated model for odor quality (Olsson 1994). Third row is the weighted intensities model (eqs 1 and 4), and fourth row is a simple arithmetic mean (eqs 1 and 3).