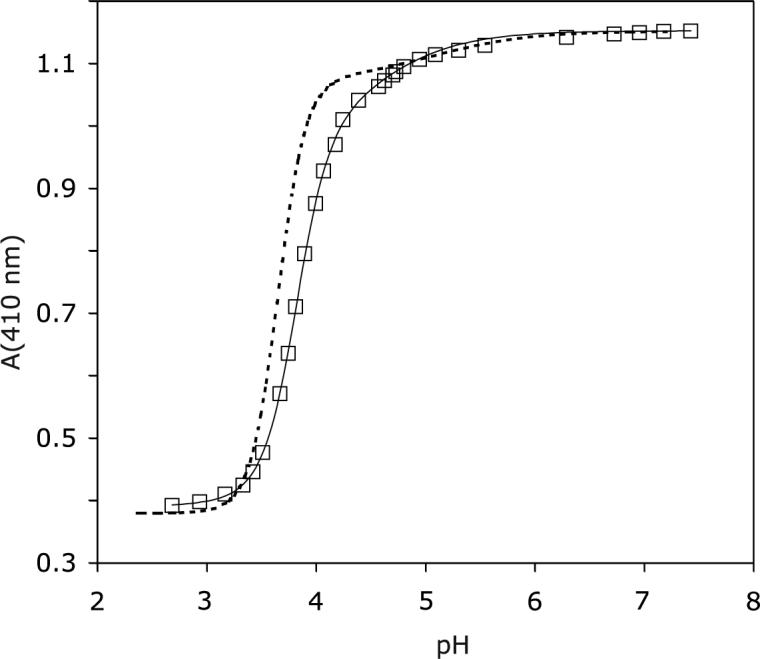
Figure 6.

pH titration of ferric A69S rHb-R. Data were collected at 25 °C. The solid line represents the fit to a two-pKa model. The main transition has pKa = 3.8 and Hill coefficient ∼ 3. The dashed line represents the results of the titration of ferric wild-type rHb-R (42), scaled to attain identical intensity at pH 7.2.
