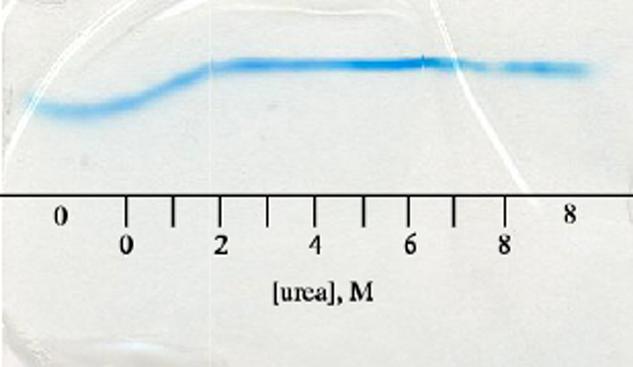
Figure 7.

Urea-gradient gel electrophoresis of wild-type and A69S apoproteins stained with Coomassie brilliant blue. The scale represents approximate urea concentrations. “0” and “8” indicate regions of the gel with constant urea concentration. The proteins begin to unfold immediately upon exposure to urea; by 2 M urea, the protein is completely unfolded, and the horizontal line corresponds to protein having an electrophoretic mobility consistent with the unfolded state. The two traces, which were observed individually, overlay perfectly in the mixture indicating that the substitution did not affect the apoprotein's resistance to urea denaturation.
