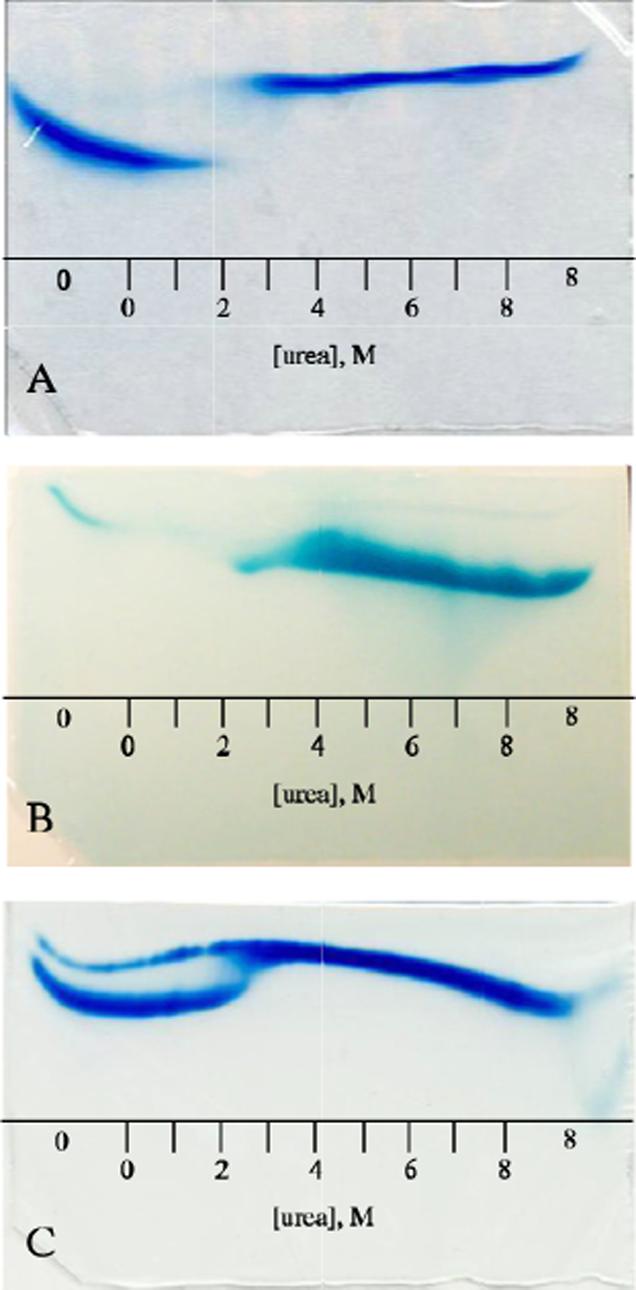
Figure 8.

Holoprotein urea-gradient gels: A) Four-hour electrophoresis of wild-type S6803 ferric rHb-R visualized by Coomassie blue. The two species observed are the natively folded holoprotein (0−2 M) and the unfolded apoprotein (∼2.5−8 M). B) 40-min electrophoresis of wild-type and A69S S6803 ferric rHb-R stained for heme. The thin band in the 0-M buffer region of the gel corresponds to heme that is specifically bound to the natively folded protein; the thick band seen from 2−8 M urea arises from heme that has escaped irreversibly from the protein. C) Four-hour electrophoresis of A69S ferric S6803 rHb-R visualized by Coomassie blue. The sample contained both the apo and holo forms of the protein. The apoprotein (thin band) mirrors the transition seen in Figure 7. The A69S holoprotein (thick band) follows the pattern of the wild-type holoprotein (Figure 8A) except that evidence of transition is seen at 2−2.5 M urea. In all cases the proteins were loaded on the gel in the native state. The scale represents approximate urea concentrations. “0” and “8” indicate regions of the gel with constant urea concentration.
