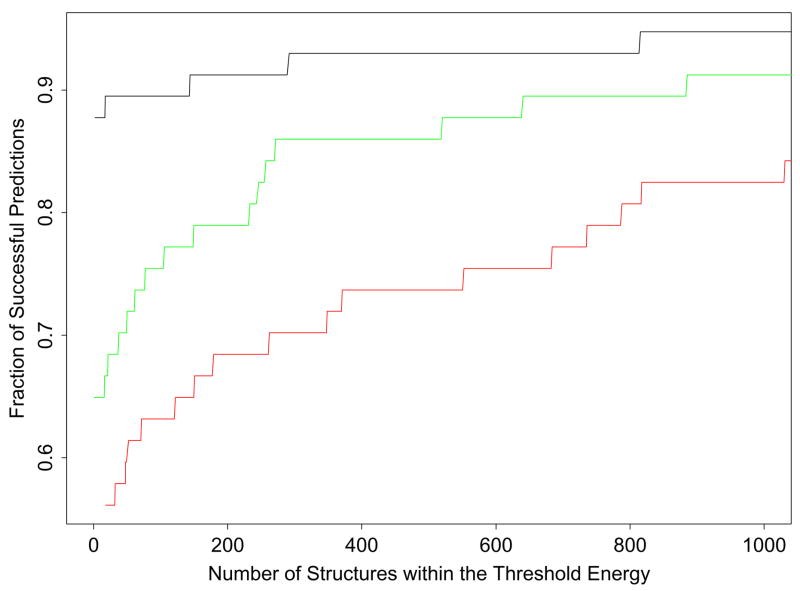
Figure 1.
We plotted the ratio between the number of successfully predicted loop targets and the total number (57) of loop targets (the fraction of successful predictions) for a given threshold energy, ΔE, versus the average number of low-energy predicted conformations within this value of ΔE for the AGBNP+, SGB/NP, and distance-dependent dielectric solvation models. All loop predictions are ordered relative to their energy from the lowest energy prediction. For an average given number of loops from the minimum (the abscissa), the fraction of proteins that have at least one native-like loop among the top number of loops is shown above along the ordinate. The black line presents the results for AGBNP+, the green line for SGB/NP, and the red line for distance-dependent dielectric.

