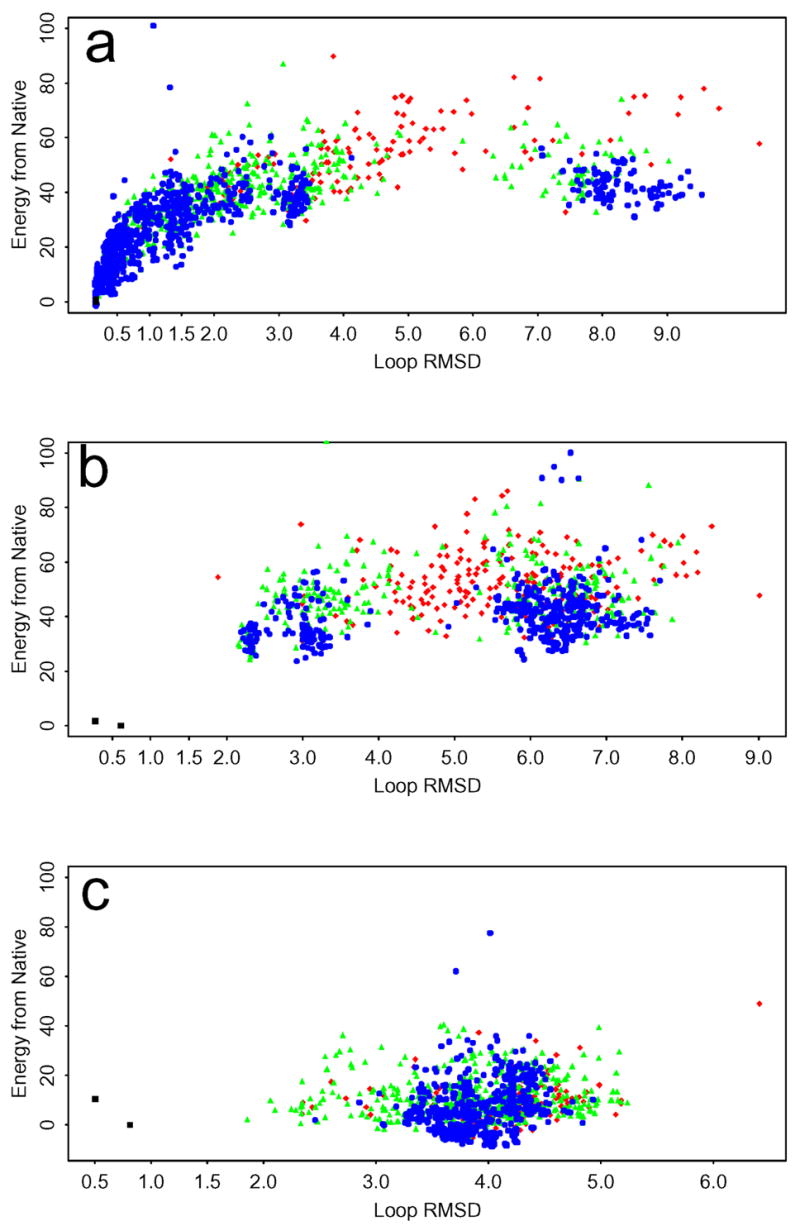
Figure 2.

Energy gaps relative to the optimized native conformation (in kcal/mol) versus the RMSD (in Å) relative to the X-ray crystal conformation for three representative 9-residue loop prediction cases with the OPLS-AA/AGBNP+ potential and the standard conformational sampling algorithm: (a) lphp(91–99) (a successful prediction), (b) lfus(31–39) (a sampling error), and (c) 3pte(215–223) (an energy error). The initial prediction results are in red, the first stage of refinement is in green, and the second stage of refinement is in blue. The native (minimized and optimized) are in black.
