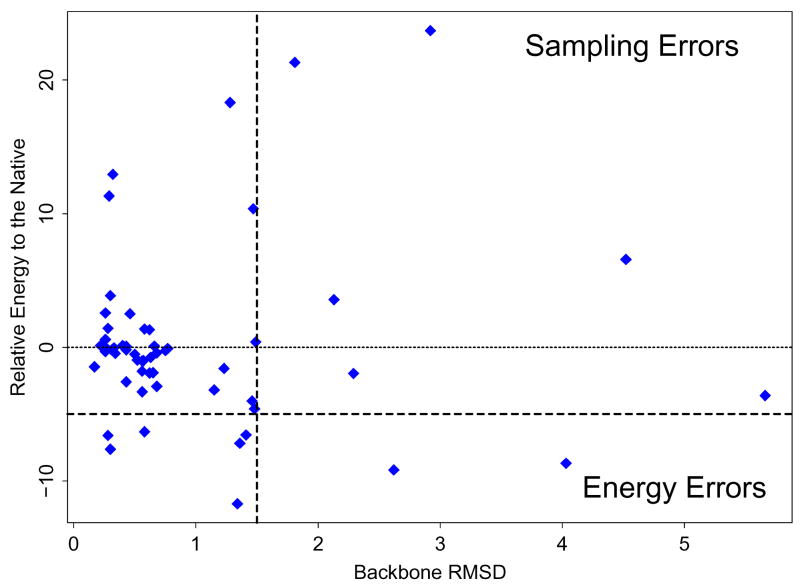
Figure 3.
The results of the OPLS-AA/AGBNP+ loop predictions on the 57 9-residue loops in Table 1. The energies (in kcal/mol) relative to the native are plotted with respect to the backbone RMSD (in Å) to the native. The vertical dashed line is the RMSD cutoff, 1.5 Å. The bold, horizontal dotted-dashed line is the energy cutoff, −5 kcal/mol. Cases corresponding to the points to the left of the RMSD cutoff line are successful predictions, those in the top-right quadrant are sampling errors, and those in the bottom-right quadrant are energy errors.

