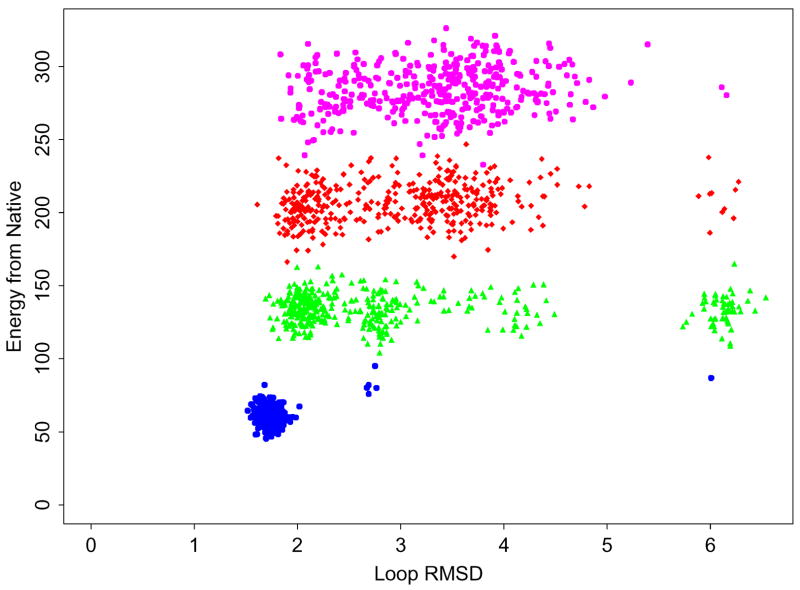
Figure 4.
Energy gaps relative to the optimized native conformation (in kcal/mol) versus the RMSD (in Å) relative to the X-ray crystal conformation for the T-REMD prediction calculation of the Ifus (31–39) loop. The conformationas from the ensembles at 270 K, 400 K, 595 K, and 800 K are shown in blue, green, red, and magenta, respectively. Energies are in kcal/mol and RMSD is in Å.

