
Figure 6.
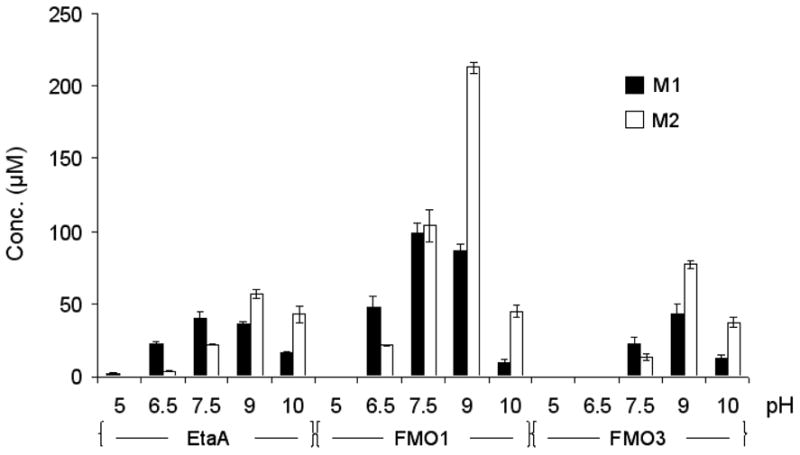
Effect of pH on the S-oxygenation of TAZ by EtaA, human FMO1, and FMO3. The results shown are the means of the normalized yields of metabolites M1 and M2 determined by integrating the corresponding HPLC peak areas and using standard curves with linear regression to calculate the metabolite concentrations.