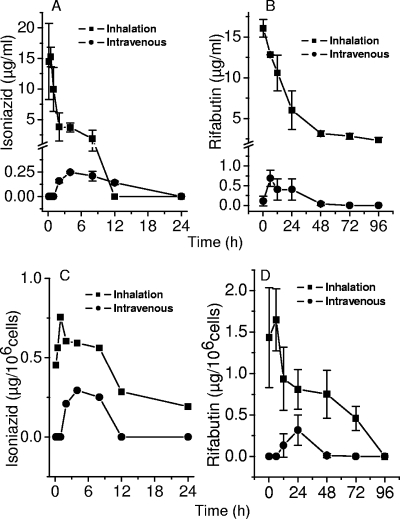
FIG. 2.
(A and C) Concentrations of isoniazid and rifabutin in BAL fluid, indicating drug concentrations in the lung lumen following inhalation or intravenous administration of 100 μg of each drug. (C and D) Intracellular concentrations of isoniazid and rifabutin in cells recovered at the same time points.

