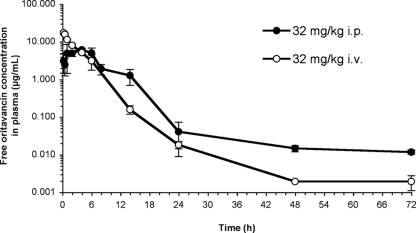
FIG. 2.
Concentration-time profile of oritavancin in mouse plasma after administration of a single 32-mg/kg dose by either the i.v. or the i.p. route. While total (bound plus free) oritavancin concentrations were measured, calculated free oritavancin concentrations, based on 93.6% protein binding in mouse serum, are plotted.

