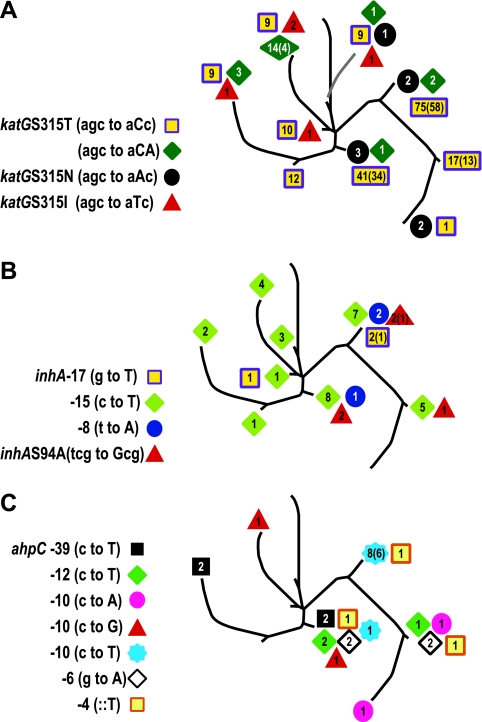
FIG. 2.
Distribution of INH-resistant SNPs. The location of each isolate containing the indicated drug resistance-associated SNPs was mapped to the phylogenetic tree shown in Fig. 1. The number of isolates harboring the mutation is shown for each allele (the number of DNA fingerprinting-defined strains is given in parentheses when it is less than the total number of isolates). (A) Mutations within katG315; (B) mutations within inhA (promoter and open reading frame); (C) mutations within the promoter region of ahpC (except for position −46, which is a non-drug-resistant SNP).

