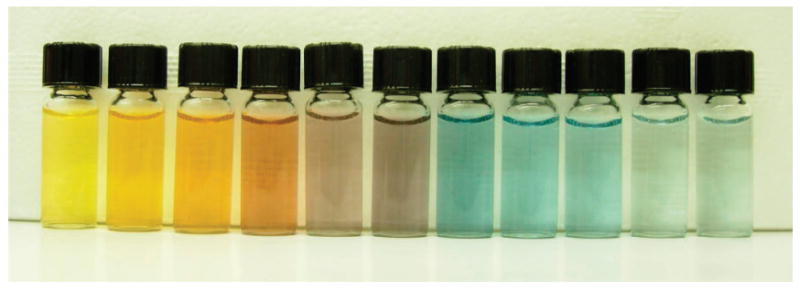
Figure 5.

Photographs of aqueous dispersion of Ag nanospheres before and after they have been titrated with different volumes of 0.03 mM HAuCl4 solution (from left to right): 0, 0.25, 0.5, 0.75, 1.0, 1.25, 1.5, 1.75, 2.0, 2.5, and 3.0 mL. The major absorption peak was positioned at 408, 425, 433, 474, 493, 557, 672, 689, 712, 756, and 791 nm, respectively.
