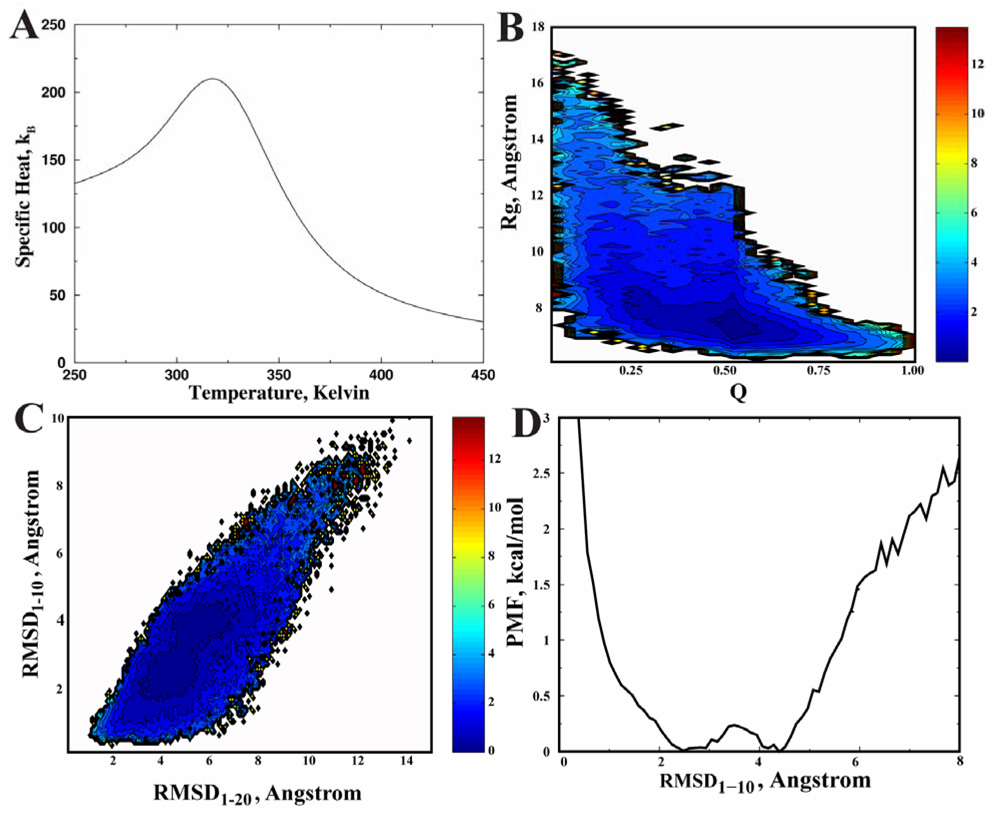
Figure 2. All-atom DMD simulation of the Trp-cage.
(A) The specific heat computed from simulations is shown as the function of temperatures. (B) The contour plot of the 2D-PMF at T=320K is plotted as the function of Q and Rg. The free energy difference between two consecutive contours is 0.6 kcal/mol in all contour plots. (C) The 2D-PMF at T=320K as a function of RMSD of the N-terminal a-helix (RMSD1–10) and the whole structure (RMSD1–20). (D) The 1D-PMF as a function of the RMSD1–10 at T=320K.

