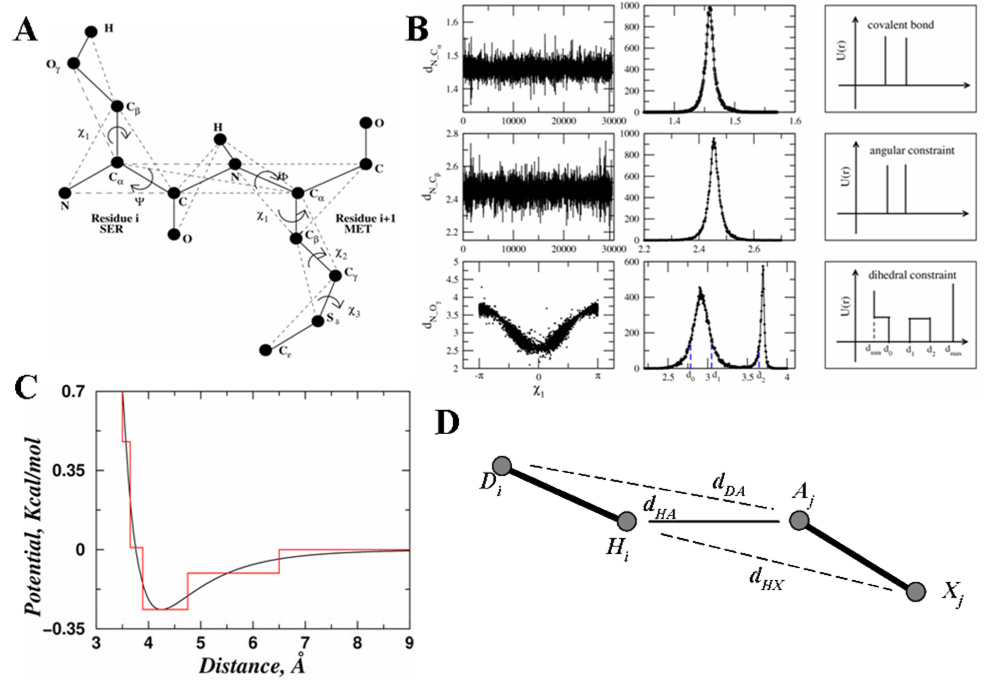
Figure 5. The all-atom protein model.
(A) Schematic diagram for the all-atom protein model. Only two consecutive residues are shown. The solid thick lines represent the covalent and the peptide bonds. The thin dash lines denote the effective bonds which are needed either to fix the bond angles, model the sidechain dihedral angles or to maintain the planarity of the peptide bonds. (B) Parameterization of the bonded interactions for representative atom pairs. The first column shows the distribution of the distances in serine, between N-Cα, N-Cβ and N-Oγ respectively. The second column shows the corresponding histogram for the distribution of each atom pair. The third column shows the resulting constraint potentials schematically. For bonds (e.g., N-Cα) and bond angles (e.g., N-Cβ), the left and right boundaries of the constraint potential corresponds to d−σ and d+σ, respectively. Here, d is the average length and σ is the standard deviation of the distance distribution. (C) Parameterization of non-bonded interactions in all-atom DMD. The continuous red line corresponds to the van der Waals and solvation interaction between two carbon atoms. The black step function is the discretized potential for DMD. (D) A schematic for the hydrogen bonding interaction between hydrogen Hi and acceptor Aj. Atom Di is the donor and Xj is the heavy atoms directly bonded to Aj. Besides the distance between hydrogen and acceptor dHA, we also assess the auxiliary distances of dDA (distance between atoms Di and Aj) and dHX (distance between atoms Hi and Xj).

