
Figure 2.
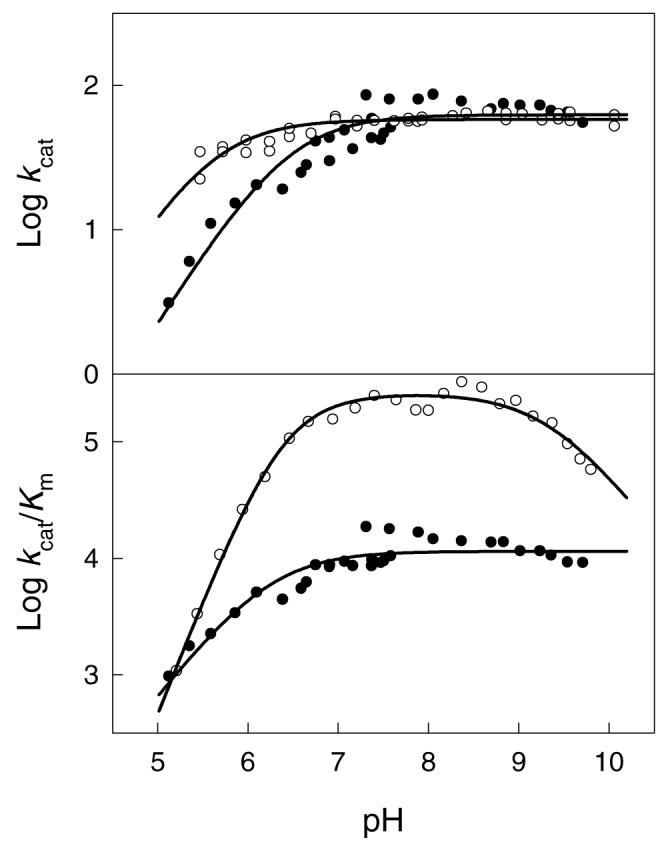
pH-rate profiles for the hydrolysis of substrates by NagA (A) log kcat vs. pH profiles for Zn-NagA with N-acetyl-d-glucosamine-6-phosphate ( ○ ) and N-acetyl-d-glucosamine-6-sulfate ( ● ). The solid lines represent fits of the data to equation 3. (B) logk cat/Km vs. pH profiles for Zn-NagA with N-acetyl-d-glucosamine-6-phosphate ( ○ ) and N-acetyl-d-glucosamine-6-sulfate ( ● ). The solid lines represent fits of the data to equations 5 and 3, respectively. Additional details are provided in the text and the dissociation constants from fits of the data to the appropriate equations are listed in Table 3.