Figure 3.

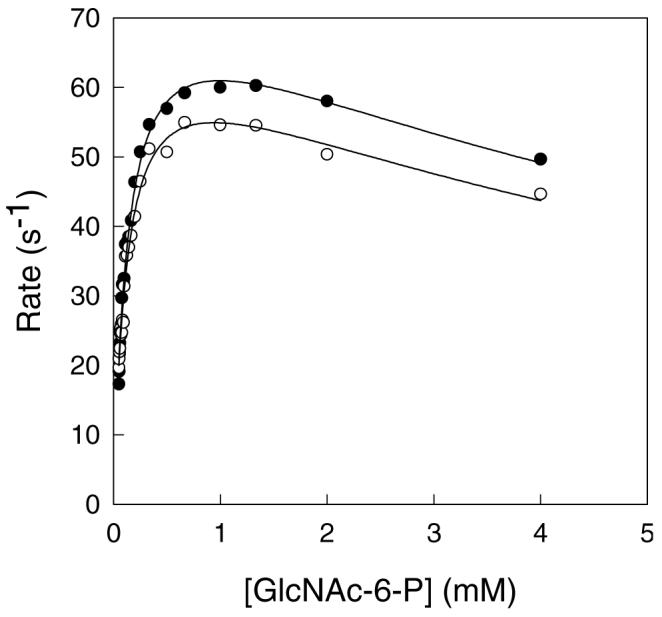
Solvent isotope effects for reactions performed in H2O ( ● ) and D2O ( ○ ) at pH/pD 7.5. The solid lines represent fits of the data to equation 2. Additional details are available in the text.

Solvent isotope effects for reactions performed in H2O ( ● ) and D2O ( ○ ) at pH/pD 7.5. The solid lines represent fits of the data to equation 2. Additional details are available in the text.